FIG. 3.
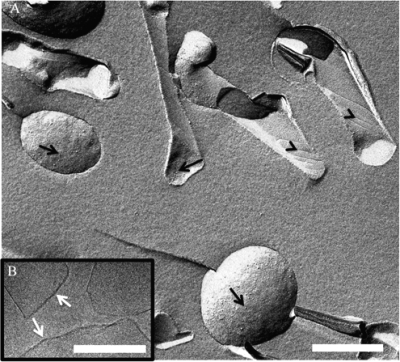
Characterization of the bilayer structure of ΔaftB membrane fragments. (A) Freeze fracture electron microscopy of purified ΔaftB membrane fragments. Arrows indicate the presence of protein particles, and arrowheads indicate striations on the fracture surface. Scale bar, 400 nm. (B) High-resolution image of frozen hydrated sample observed by cryo-EM reveals the bilayer structure of the fragments (arrows). Scale bar, 200 nm.

