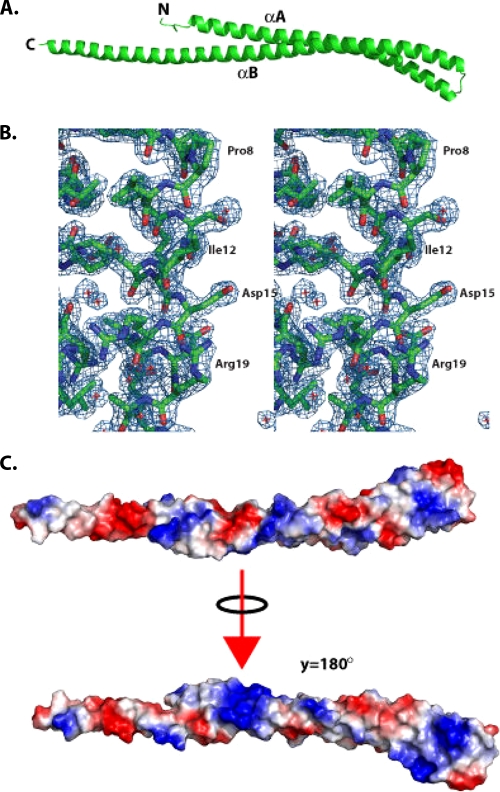
FIG. 1.
Structure of CT670. (A) Ribbon diagram of CT670, with the two helices and N and C termini labeled. (B) Electron density obtained from a 2Fo-Fc map generated from the final model, contoured at 1σ. A region representing the N terminus of helix αA is shown, and selected residues on one face of helix αA are labeled for clarity. (C) Electrostatic potential mapped on the molecular surface of the CT670 monomer, shown in two orientations, the first corresponding to the orientation shown in panel A and the second corresponding to a 180° rotation about the y axis relative to the first orientation.

