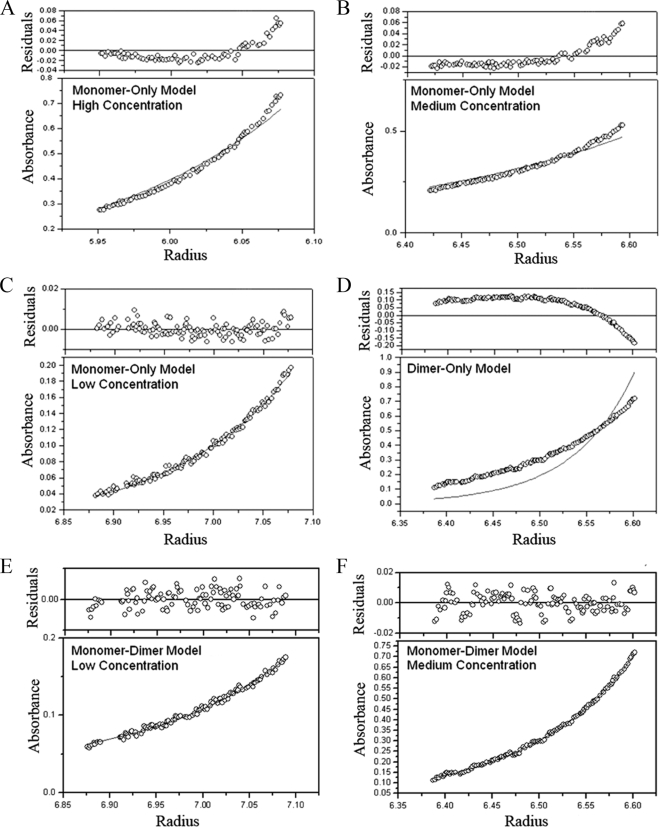
FIG. 3.
Analyses of different self-association models for His6-CT670 by sedimentation equilibrium. The results for sedimentation equilibrium from 15 data sets obtained at different protein concentrations and sedimentation speeds (see Materials and Methods) were fitted to different models. The plots were generated using Origin 6.0. (A, B, and C) Plots for a monomer-only model for three protein concentrations (low, medium, and high) of CT670 from data obtained by centrifugation at 29,120 × g. (D) Data fit for a dimer-only model (at the medium protein concentration) for centrifugation at 29,120 × g. (E and F) Data fit for a monomer-dimer model for (E) the low relative protein concentration for centrifugation at 16,380 × g and (F) the medium relative protein concentration for centrifugation at 29,120 × g.

