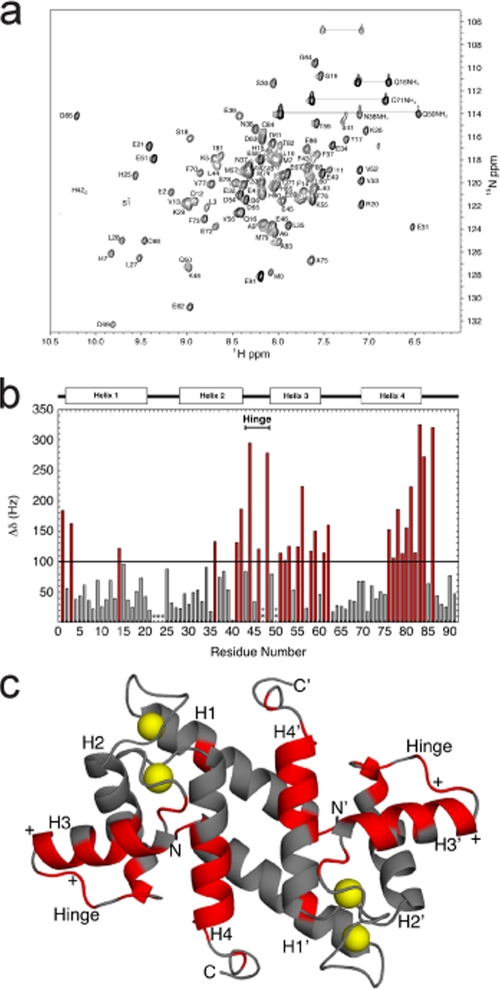
FIG. 6.
Interaction between calcium-bound S100B and the ATAD3A peptide (P290-305) examined by NMR spectroscopy. (a) Two-dimensional 1H-15N HSQC spectrum of 15N-labeled Ca2+-S100B bound to the ATAD3A peptide (unlabeled). The conditions of the NMR sample are described in Materials and Methods. (b) Histogram of chemical shift perturbations (Δδ in Hz for 1H + 15N) as a result of titrating the ATAD3A peptide into calcium-bound S100B. Residues that showed perturbations greater than 100 Hz are in red. (c) Ribbon diagram of the NMR structure of Ca2+-bound S100B (PDB accession number 2K7O), with those residues having chemical shift perturbations upon the addition of the ATAD3A peptide greater than 100 Hz in red. The yellow spheres represent calcium ions in the two EF hands (EF1 and EF2) in each subunit of dimeric calcium-bound S100B.

