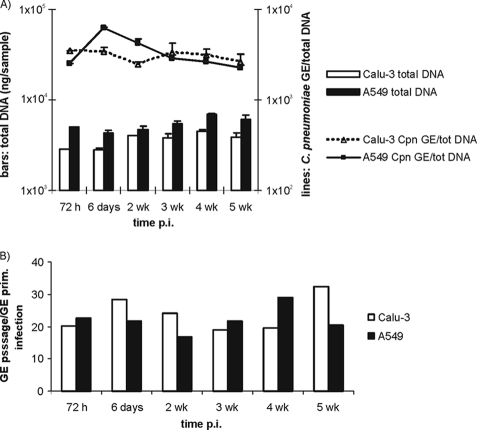
FIG. 4.
Five-week follow-up of C. pneumoniae (Cpn) infection in filter-grown Calu-3 and A549 cell cultures. (A) Bars represent the amount of total DNA per sample in Calu-3 (□) and A549 (▪) cultures collected at different times postinfection. Lines represent the number of C. pneumoniae genome equivalents (GE) divided by the amount of the total DNA. Averages of duplicate samples and standard errors of the mean are presented. (B) Fold change in C. pneumoniae GE numbers after passage from a 5-week follow-up calculated as described in Fig. 3.

