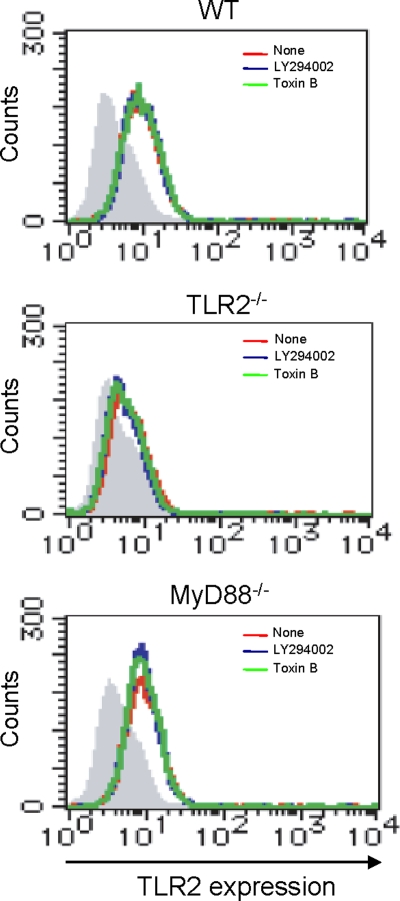
FIG. 7.
The effect of LY294002 and toxin B on the expression of TLR2 on macrophages. WT, TLR2−/−, and MyD88−/− macrophages were incubated with 20 μM LY294002 or 40 ng ml−1 toxin B for 1 h and treated with anti-CD16/32 MAb (IgG2b), followed by staining with FITC-conjugated anti-TLR2 MAb (IgG2b) or control IgG2b. The level of TLR2 expression was analyzed by FACS. The histogram with the red line shows the level of TLR2 expression on macrophages without treatment, the blue line represents the level of TLR2 expression on macrophages treated with LY294002, and the green line shows the level of TLR2 expression on macrophages treated with toxin B. The hatched area represents the basal fluorescent intensity in cells treated with control IgG2b.

