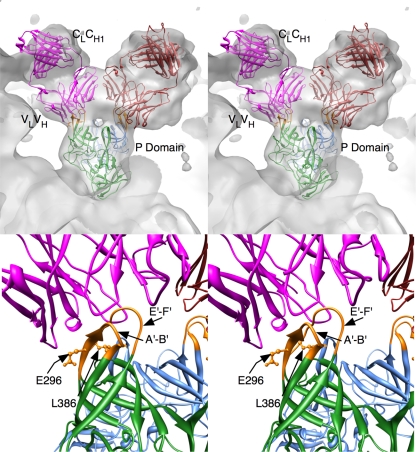
FIG. 7.
3D modeling of an antibody-P-domain complex. Shown are stereo diagrams of Fab17 and the MNV-1 P domains fitted into the 3D image reconstruction of the MNV-1-Fab complex, in gray. The blue and green ribbon figures represent the A and B subunits in the MNV-1 structure, respectively. The mauve and red ribbon figures represent the two copies of Fab17 bound to the P-domain dimer. At the bottom is shown a close up of the MNV-1-Fab interactions with the contact residues highlighted in orange in the P-domain dimer. Also noted are the locations of residues E296 and L386, the attenuation and escape mutation sites, respectively.

