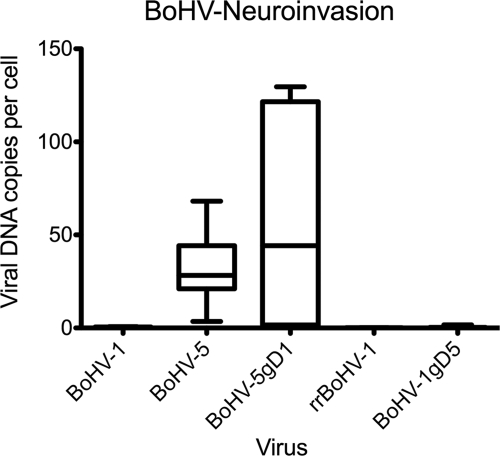
FIG. 6.
DNA of BoHV-5 and BoHV-5gD1 in brain tissue. DNA was extracted from the brains of each animal and subjected to real-time PCR and quantification of the viral DNA load per cell as described in Materials and Methods. The viruses used for inoculation are listed on the x axis. Box plots refer to the y axis and show mean values, the 75th percentile (box), as well as the maximal and minimal values (whiskers).

