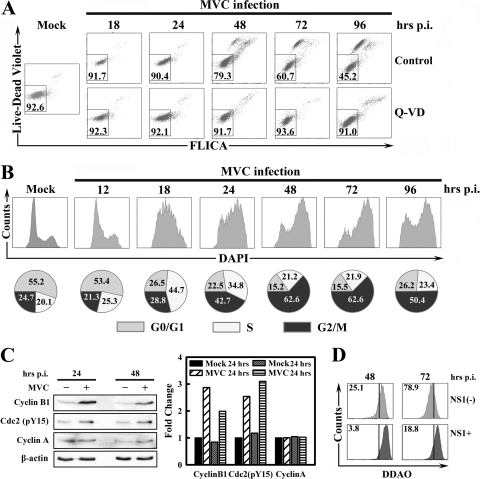
FIG. 1.
MVC infection induces apoptosis and cell cycle arrest. WRD cells were infected with MVC at an MOI of 3. (A) Cells were cultured in media supplemented with DMSO as a control or a pan-caspase inhibitor Q-VD (R&D Systems) at 40 μM immediately after infection. At indicated times p.i., infected cells were triple stained by anti-NS1, Live/Dead Violet, and poly-FLICA. Anti-NS1-stained cells were selected and plotted as Live/Dead Violet versus poly-FLICA fluorescence. The percentage of live cells (double negative) is shown in the square gate. (B) At the indicated times p.i., cells were double stained by anti-NS1 and DAPI. The anti-NS1-stained cells were selected and plotted as cell counts versus DAPI staining. Percentages of cells in the G0/G1, S, and G2/M phases are shown in circle graphs at the bottom of the panel. (C) Mock- and MVC-infected WRD cells were harvested at 24 h and 48 h p.i., respectively. Cell lysates were subjected to Western blotting using anti-cyclin B1, anti-cdc2 (pY15), anti-cyclin A, and anti-β-actin, respectively. The levels of signals on blots, which are normalized to the level of β-actin, are shown in the bar chart to the right. The normalized value of the mock cells at 24 h is arbitrarily set to 1. (D) At 24 h and 48 h p.i., MVC-infected WRD cells were stained with DDAO and anti-NS1. Both anti-NS1-positive (NS1+) and anti-NS1-negative [NS1(−)] populations were gated and plotted as histograms of cell counts versus DDAO signal. Numbers as shown are percentages of proliferated cells. The line as shown is arbitrarily set based on the nonproliferated control cells, which were fixed immediately after infection. A representative of two independent experiments is shown in panels A to D.

