FIG. 2.
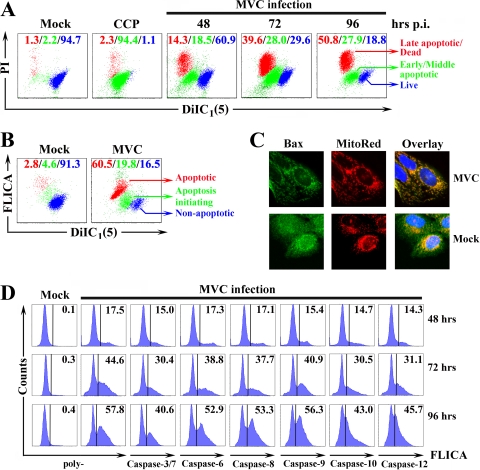
MVC infection-induced apoptosis is mitochondrion mediated. WRD cells were infected with MVC at an MOI of 3. (A) MVC-infected cells were harvested at indicated times p.i. and double stained with PI and DilC1(5). A mock infection control and an MOMP-positive control (CCCP-treated cells) were included. Stained cells were thereafter analyzed by flow cytometry and plotted as PI staining versus DilC1(5) staining. The DilC1(5)high/PI− (blue) population represents live cells; DilC1(5)low/PI− (green) cells are in the early and middle stages of apoptosis; DilC1(5)low/PI+ (red) cells are late apoptotic or dead cells. The percentage of each cell population is shown in color. A representative of two independent experiments is shown. (B) MVC-infected WRD cells, at 96 h p.i., were double stained with poly-FLICA and DilC1(5). A representative dot plot is shown. The DilC1(5)high/FLICA− (blue) population represents live cells; the DilC1(5)low/FLICA− (green) population are cells in the initial stage of apoptosis; the DilC1(5)low/FLICA+ (red) population are both apoptotic and dead cells. The percentage of each cell population is shown in color. (C) At 48 h p.i., mock- or MVC-infected WRD cells were stained with MitoTracker Red (red) and anti-Bax (green). Representative confocal images were taken. Nuclei were stained with DAPI. (D) At the indicated times p.i., MVC-infected WRD cells were stained with anti-NS1 and various FLICA peptides as shown. Anti-NS1-stained cells were selectively gated and plotted in histogram form to show the FLICA signals of NS1-expressing cells. Mock cells were all plotted as poly-FLICA staining. The percentage of FLICA positive cells is shown. A representative of two independent experiments is shown.

