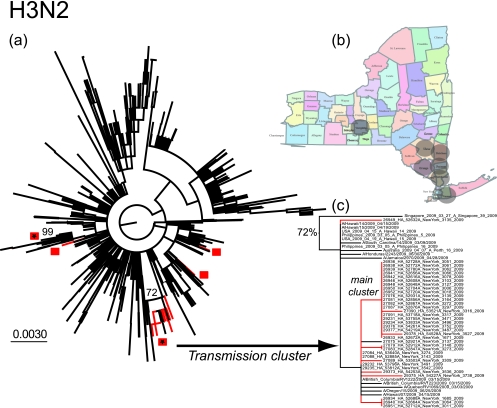
FIG. 2.
(a) ML tree (unrooted) of 1,258 HA1 sequences of seasonal H3N2 sampled globally during the period from 2008 to 2009. The 41 viruses sampled from New York State during the period 27 April to 1 June are shaded red, with each likely introduction event marked by a square. Possible transmission clusters are noted by asterisks, and their associated bootstrap values are also shown. Although a bootstrap value <70% is observed for the main transmission cluster, this group of sequences is strongly supported (0.84) under the approximate likelihood ratio test available in PHYML. (b) Counties of New York State from where the putative H3N2 transmission cluster was sampled (shaded circles). (c) Magnification of the 21-sequence cluster that provides strong evidence for the unseasonal transmission of H3N2.

