
FIG. 2.
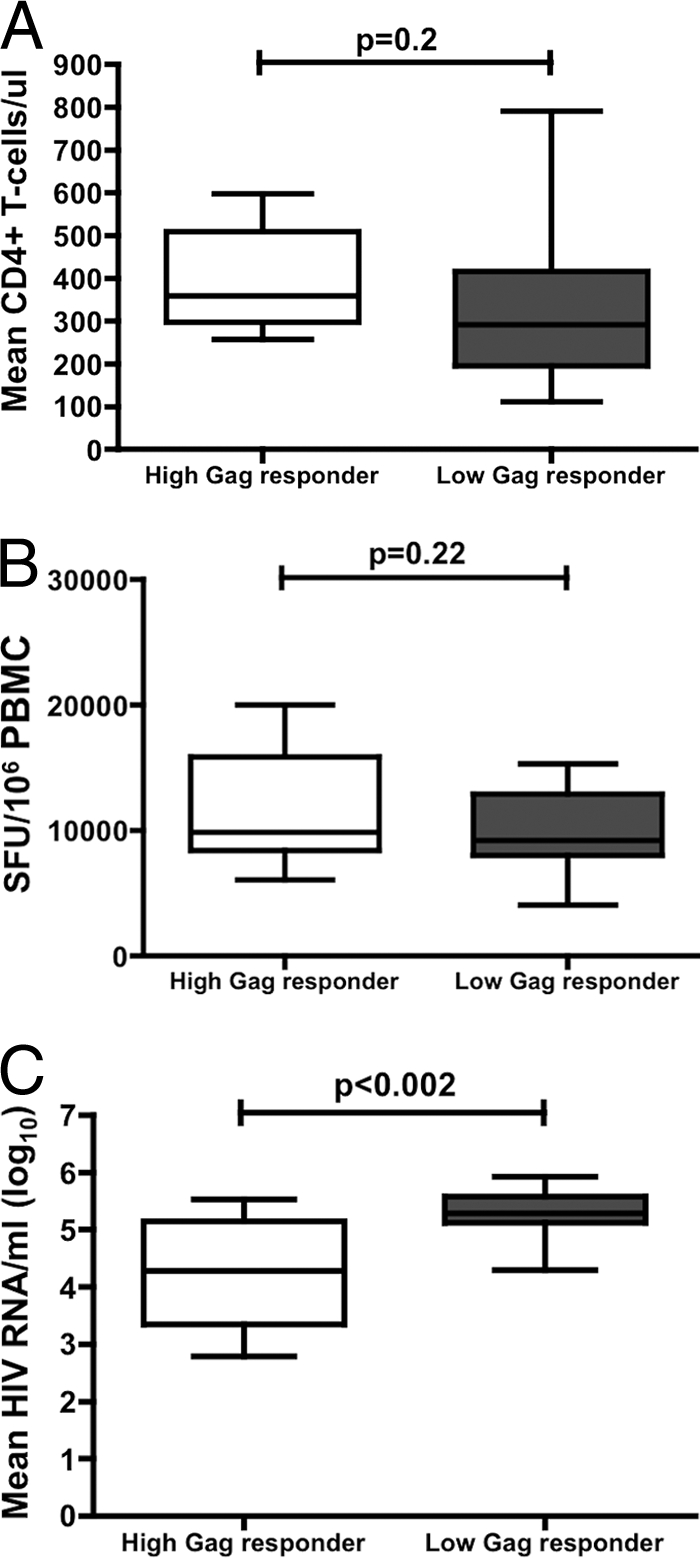
Characteristics of high (n = 13) and low (n = 13) Gag responders. (A) The mean total CD4 T-cell counts were measured by flow cytometry (B) HIV-specific CD8 T-cell responses in isolated PBMCs measured by IFN-γ ELISPOT assay in high and low Gag-responders. (C) The total magnitude of plasma HIV-1 RNA measured by PCR.