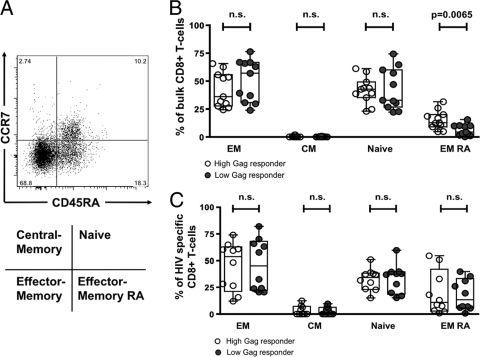
FIG. 5.
(A) Representative flow plot with gating strategy. (B and C) Phenotype of bulk CD8 T cells (B) and HIV-specific CD8 T cells (C) comparing high Gag responders (n = 10) versus low Gag responders (n = 10). EM, effector memory (CD45RA−/CCR7−); CM, central memory (CD45RA−/CCR7+); naïve (CD45RA+/CCR7+); EM RA, effector memory RA (CD45RA+/CCR7−). n.s., not significant.

