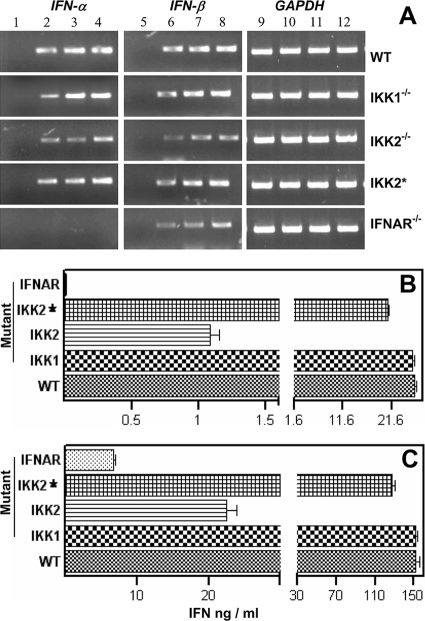
FIG. 5.
Quantification of type I IFN production by RT-PCR analysis and ELISA. (A) As indicated on top, RT-PCR analysis of IFN-α, IFN-β, and GAPDH expression was performed for 27 cycles using JEV-infected wild-type (WT), IKK1−/−, and IKK2−/− MEFs; IKK2−/− cells that were reconstituted with the wild-type IKK2 transgene (IKK2*); and IFNAR−/− MEFs. Lanes 1, 5, and 9 represent cells that were mock infected for 36 h; lanes 2, 6, and 10 represent cells that were infected for 12 h; lanes 3, 7, and 11 represent cells at 24 p.i.; and lanes 4, 8, and 12 represent cells obtained at 36 h after infection. (B and C) Quantification of IFN-α and IFN-β in the supernatants of JEV-infected MEFs. As indicated on the left, wild-type (WT), IKK1−/−, and IKK2−/− MEFs; IKK2−/− cells that were reconstituted with the wild-type IKK2 transgene (IKK2*); and IFNAR−/− MEFs were infected for 36 h, and the levels of IFN-α (B) and IFN-β (C) in culture supernatants were analyzed by ELISA. Data represent the mean levels of IFN (ng/ml) produced from 2 × 10⁶ cells ± standard errors of the means of triplicate assays in a total volume of 2.5 ml.

