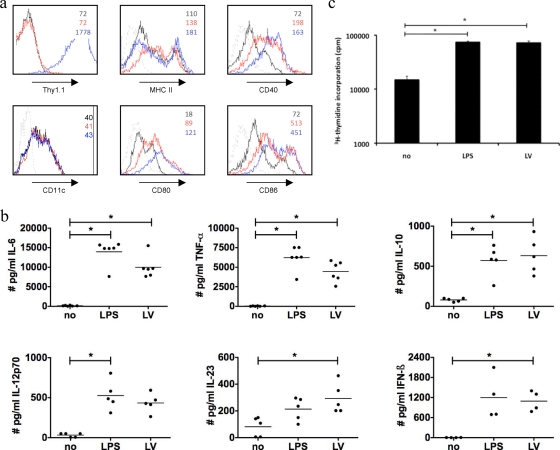
FIG. 1.
Activation of DC following in vitro lentiviral transduction. At day 7 of culture, DC were plated at 106 DC/ml medium. These DC were not manipulated (no), incubated with 100 ng/ml LPS for 24 h (LPS), or transduced with lentiviral vectors encoding Thy1.1 at an MOI of 15 (LV) (n = 5). (a) Flow cytometric analysis performed 24 h after transduction. The expression of CD11c, Thy1.1, CD40, CD80, CD86, and MHC class II on the immature (black), mature (red), and transduced (blue) DC was evaluated. The gray line represents isotype control staining. The numbers in the graph represent the mean fluorescence intensities (MFI). Data from one representative experiment out of five are shown. (b) Levels of cytokines in supernatants of immature (no), mature (LPS), and transduced (LV) DC. Each experiment is represented by a dot, and the horizontal line indicates the mean. These DC were used as stimulators in a mixed-lymphocyte reaction at a stimulator-to-responder ratio of 1 to 100. The proliferation of allogeneic CD90+ T cells was evaluated 4 days after the start of the coculture as a measure for DC functionality. (c) Proliferation was measured by [3H]thymidine incorporation. The data shown are representative of data from one experiment out of five independent experiments.

