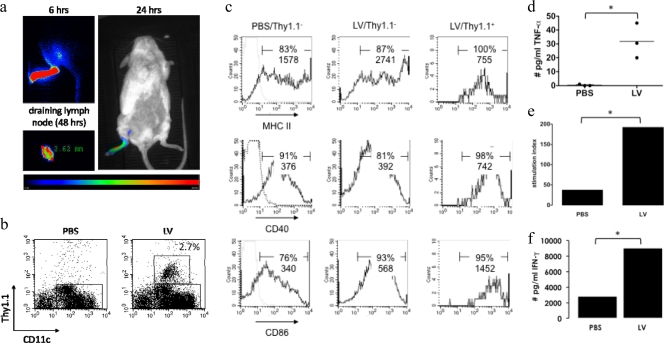
FIG. 3.
Tracking and evaluation of in vivo-transduced cells. (a) In vivo bioluminescence imaging was performed 6, 24, and 48 h after footpad injection of 107 TU of lentiviral vectors encoding firefly luciferase. (b) Thirty-six hours after the subcutaneous administration of lentivectors encoding Thy1.1, lymph nodes were isolated, and CD11c+ cells were sorted and stained for Thy1.1 (n = 3). (c) Isolated cells were stained for CD40, CD86, and MHC class II. Cells were gated as CD11c+/Thy1.1− or CD11c+/Thy1.1+. The graphs in b and c are representative of data from three independent experiments and show the percentages and MFI of marker-positive cells. (d) Production of TNF-α by the DC. Each experiment is represented as a dot, and the horizontal line shows the mean. The CD11c+ cells were loaded with the MHC class I-restricted ovalbumin peptide SIINFEKL or an irrelevant peptide (Trp2 [SVYDFFVWL]) and cultured at a stimulator-to-responder ratio of 1 to 100 with ovalbumin TCR-transgenic CD8+ T cells (n = 2). (e and f) Proliferation of T cells (e) and production of IFN-γ (f) by these T cells. The results are representative of data from two independent experiments.

