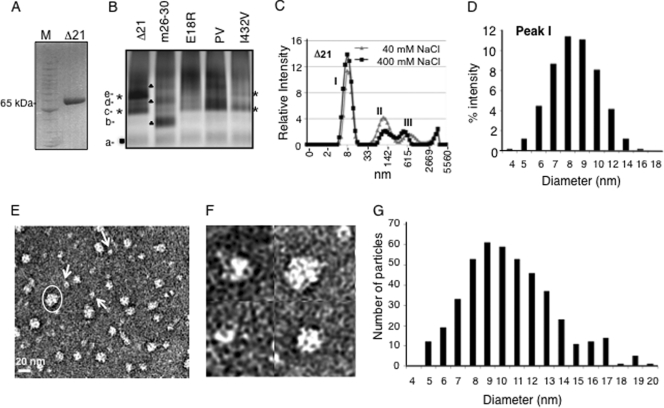
FIG. 2.
Analysis of the conformations and oligomeric states of the HCV RdRp. (A) SDS-PAGE demonstrating the mobility of the Δ21 protein at ∼65 kDa under denaturing conditions. The molecular mass markers are from Invitrogen (Benchmark protein ladder). (B) Blue-native gel of Δ21 and its variants that are affected for RNA synthesis. The different bands that were distinct in mobility and intensity are labeled from a to e. Bands that were common to all proteins are indicated by a filled box; bands common to the Δ21 and I432V proteins are shown with asterisks; bands in m26-30 are shown with filled triangles. (C) DLS analysis of Δ21 at 40 mM and 400 mM NaCl. (D) Polydisperse nature of the peak I from panel C. (E) A representative EM image of 5 ng/μl Δ21 in a Tris buffer containing 100 mM NaCl. The particles were stained with uranyl acetate after adsorption onto carbon grids. The scale bar is shown at bottom left. The arrows point to the likely monomers based on the estimated sizes of the particles. Note that some monomeric particles may represent different orientations attached to the grid, hence appearing in different shapes. One of the oligomers is indicated with an oval. (F) Magnified view of micrographs showing putative Δ21 monomers and oligomers. (G) A histogram of the dimensions of 440 particles of Δ21 picked from different micrographs. The measurements were made manually using the image processing software ImageJ (NCBI) at a 2.35-Å/pixel ratio at the specimen level. Two measurements were taken each at the longest and widest dimensions of each particle at roughly perpendicular angles, and the averages of the two measurements are plotted as histograms.

