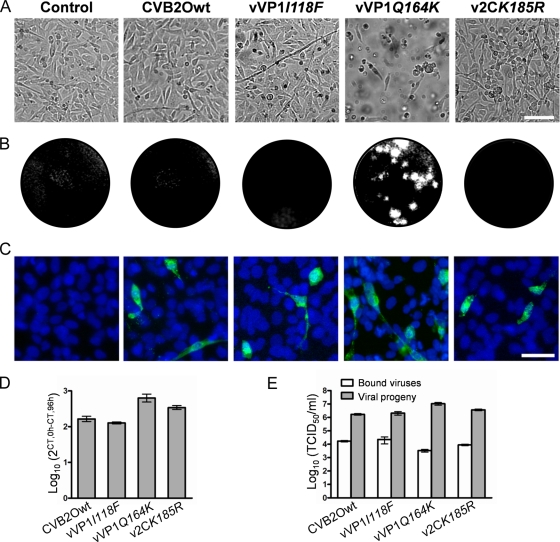
FIG. 3.
Characterization of CVB2O infection in RD cells. (A) Uninfected RD cells (control) and RD cells infected with CVB2Owt, vVP1I118F, vVP1Q164K, and v2CK185R at an MOI of 1 TCID50/cell. Cells were visualized by light microscopy (96 h p.i.). Bar, 100 μm. (B) Plaque morphology of the CVB2O variants (96 h p.i.). Plaques were visualized by crystal violet staining of RD cells. (C) Immunostaining of RD cells infected with the different CVB2O viruses (MOI of 1). Viruses were detected (24 h p.i.) with an anti-CVB2 monoclonal antibody and a secondary antibody labeled with Alexa Fluor 488 (green). The cellular nuclei were visualized with DAPI (blue). Bar, 50 μm. (D) Quantitation of viral genome replication. RD cells were infected with CVB2O virus variants (MOI of 1) and the amount of positive-sense RNA was quantified by real-time PCR (0 h and 96 h p.i.). The amount of viral RNA was determined by the cycle threshold (CT) value and is presented as the fold change (mean ± SEM) of viral RNA for triplicate samples (from 0 h to 96 h p.i.). (E) CVB2O progeny production in RD cells measured by titration. RD cells were infected (MOI of 1), and the number of infectious viral particles was determined by the TCID50 method for bound viruses (0 h p.i.) and virus progeny (96 h p.i.). Results are presented as the mean ± SEM (n = 3).

