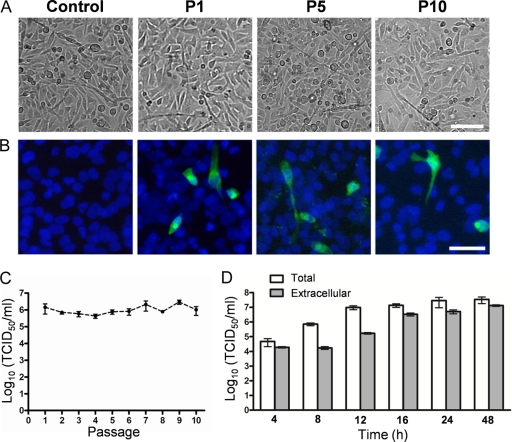
FIG. 4.
RD cells persistently infected with CVB2Owt. (A) RD cells persistently infected with CVB2Owt at passage 1 (P1), P5, and P10. Successive passages were performed every fourth day. Bar, 100 μm. (B) Immunofluorescence micrographs of persistently infected RD cells. Infected RD cells from passages 1, 5, and 10 were cultured in chamber slides and fixed after 24 h. Viral protein expression was analyzed with a mouse anti-CVB2 monoclonal antibody, followed by a secondary antibody labeled with Alexa Fluor 488 (green). Nuclei were visualized with DAPI (blue). Bar, 50 μm. (C) RD cells infected with CVB2Owt (MOI of 1) were cultured, and successive 1/3 passages were performed every fourth day. The release of progeny virus during noncytolytic infection was quantified at passages 1 to 10 by endpoint titration in GMK cells (mean ± SEM; n = 3). (D) Release of virus progeny from RD cells infected with CVB2Owt (MOI of 1). Extracellular (viruses present in the medium) and total (extra- and intracellular) virus yields were determined at different time points after infection by endpoint titration in GMK cells. Error bars represent the SEM (n = 3).

