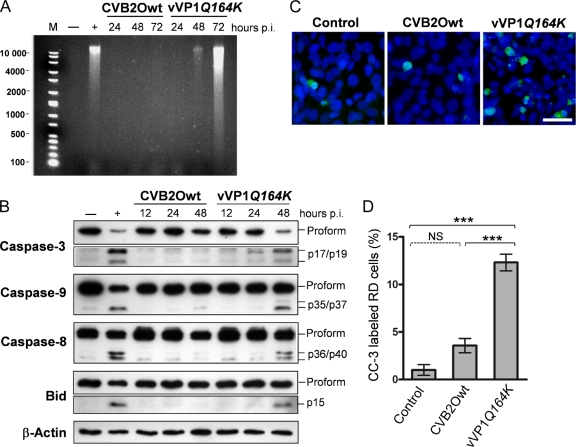
FIG. 6.
Apoptotic status of RD cells infected with CVB2Owt and vVP1Q164K. RD cells were infected with the CVB2O viruses at an MOI of 1 and incubated at 37°C. (A) At the indicated times postinfection, cells were harvested, and DNA was extracted and resolved by electrophoresis in a 1% agarose gel as described in Materials and Methods. Uninfected RD cells (−) and cells treated with STS for 12 h (+) were used as negative and positive controls, respectively. M, molecular weight marker. (B) At the indicated times postinfection, RD cell lysates were prepared, and equal amounts of proteins (5 to 40 μg) were assayed for caspase-3, caspase-9, caspase-8, and Bid by Western blotting. Uninfected RD cells and cells treated with STS for 8 h were used as negative and positive controls, respectively, while expression of actin was used as a control of equal protein loading. Activated forms of Bid and caspase-3 are shown after longer durations of exposure than the unprocessed fragment. The molecular masses of the active fragments are indicated in the right margin. The results shown are representative of three independent experiments. (C) RD cells infected with CVB2Owt and vVP1Q164K were fixed at 24 h postinfection and analyzed with a polyclonal antibody against cleaved/activated caspase-3 (CC-3). CC-3 was visualized with a secondary antibody conjugated with Alexa Fluor 488 (green), and nuclei of RD cells were visualized with DAPI (blue). (D) Induction of apoptosis determined by caspase-3 activation. The percentage of CC-3-labeled RD cells from each sample was estimated from >300 randomly counted nuclei. Error bars represent the SEM (n = 3). A P value of <0.001 (***) was statistically significant for vVP1Q164K versus CVB2Owt or control cells. NS, not significant (P > 0.05).

