FIG. 3.
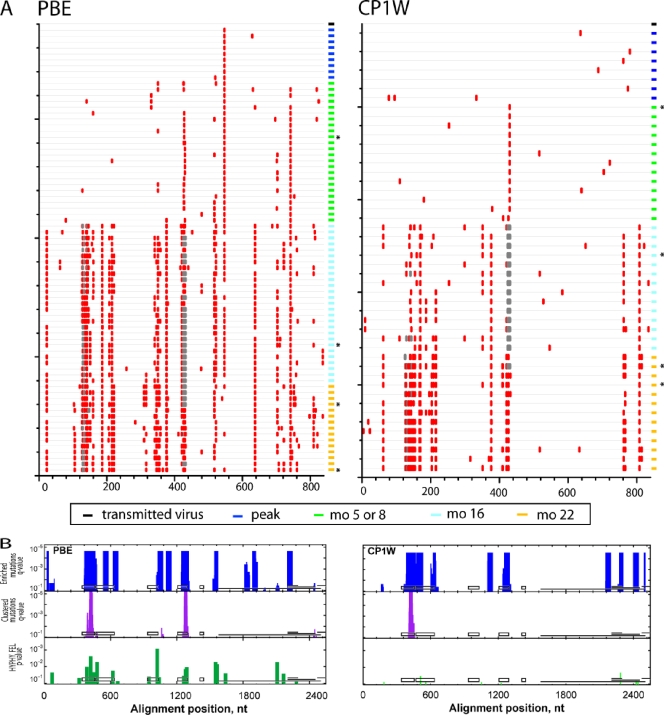
Accumulation of env nucleotide sequence changes in replicating viruses after intrarectal SIVmac251 infection. (A) Highlighter alignment of env genes that were transmitted from the inoculum (black rectangle at top right of each alignment), at peak viremia (dark blue rectangles), or 5 or 8 (green rectangles), 16 (light blue rectangles), and 22 (yellow rectangles) months p.i. in animals PBE and CP1W. Each horizontal line on the vertical axis depicts individual Env variants sequenced at various time points postinfection. Identical sequences were removed for clarity. The red tic marks indicate differences that are nonsynonymous in the env coding frame. Deletions are indicated by gray tics. The horizontal axis indicates the amino acid position in the Env alignment. (B) Identification of putative sites of positive selection using three independent tests. The horizontal axis indicates the nucleotide positions in env, aligned to SIVmac239 (nt 6604 to 9108), and the vertical axis indicates the statistical significance for each of the three tests. The tests for enriched mutations and clustered mutations (turquoise and purple bars, respectively) used sliding windows of 45 and 27 nt, respectively. The FEL test from HYPHY is a tree-based statistic that identifies single codons under positive selection (green bars). For reference, the black boxes depict the locations of V1 to V5 in gp120, and the horizontal lines depict the locations of gp41, tat exon 2, rev exon 2, and nef (in reading frames 1, 3, 2, and 3, respectively). The asterisks denote Env variants from each animal that were cloned for further neutralization testing.

