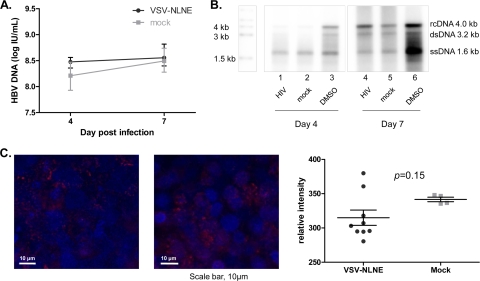
FIG. 4.
Changes in HBV DNA expression following HIV coinfection. (A) HBV DNA in cytoplasmic extracts from AD38 cells collected 4 and 7 days after infection with VSV-NLNE or mock infection was quantified. The median and range from four different experiments are shown. (B) Southern blot analysis of cell lysates of AD38 cells 4 days after infection with VSV-NLNE (lane 1), mock infection (lane 2), or treatment with 1% DMSO (lane 3) and 7 days after infection with VSV-NLNE (lane 4), mock infection (lane 5), or treatment with 1% DMSO (lane 6). Data are representative of six independent experiments. Markers show the sizes of rcDNA, dsDNA, and ssDNA. (C) HBcAg expression in AD38 cell monolayers 3 days after infection with VSV-NLNE (left panel) or mock infection (right panel) using fluorescence microscopy. Hoechst staining of nuclei is blue, and HBcAg staining is red. Magnification, ×40. Right panel, quantification of the relative intensity of HBcAg staining using softWoRx software (Applied Precision, Issaquah, WA) following infection with VSV-NLNE or mock infection. Each symbol represents a separate field from the same experiment. The black lines show the mean ± SE.

