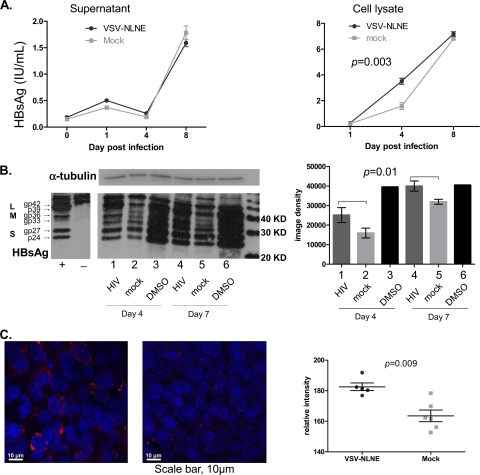
FIG. 5.
Expression of HBsAg following HIV coinfection. (A) HBsAg in cell culture supernatant (left panel) and cell lysates (right panel) from AD38 cells infected with VSV-NLNE or mock infected was quantified using the Architect assay (Abbott). The median and range for duplicate samples are shown. Statistical significance was determined by two-way analysis of variance (ANOVA) of duplicate samples from one experiment. A similar trend was seen in two further separate experiments. (B) HBsAg was quantified by Western blotting (left panel) of AD38 cell lysates 4 days (lanes 1 to 3) and 7 days (lanes 4 to 6) after infection with VSV-NLNE (lanes 1 and 4) or mock infection (lanes 2 and 5) or in the presence of 1% DMSO (lanes 3 and 6). Specificity of HBsAg staining is demonstrated in the positive (AD38 cells) and negative (HepG2 cells) controls from a separate gel. Input protein was normalized and confirmed by expression of α-tubulin. Quantification of HBsAg using image density (right panel) is also shown for the median and SE from five experiments. Statistical significance was determined by two-way ANOVA of results from three separate experiments. (C) HBsAg in AD38 cell monolayers was quantified 3 days after infection with VSV-NLNE (left panel) or mock (right panel). Hoechst staining of nuclei is shown in blue. HBsAg is shown in red. Magnification, ×40. Right panel, quantification of the relative intensity of HBsAg staining using softWoRx software (Applied Precision, Issaquah, WA) following infection with VSV-NLNE or mock infection. symbols). Each symbol represents a separate high-power field from the same experiment. The black lines show the mean ± SE.

