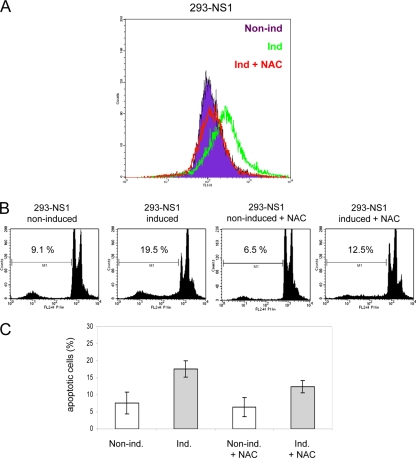
FIG. 7.
Involvement of ROS production in NS1-induced apoptosis. (A) The levels of ROS in control 293-NS1 cells (non ind., purple) or cells expressing NS1 in the presence (ind.+NAC, red) or absence (ind., green) of the antioxidant NAC (5 mM) were determined by loading the cells with DCFH-DA, followed by flow cytometric analysis at 24 h postinduction. (B) Representative FACS histograms showing the analysis of apoptotic cells by measuring the sub-G1 population after 72 h of growth under the conditions indicated. (C) FACS data obtained from three independent experiments performed in triplicate. Values shown are the means ± standard deviations.

