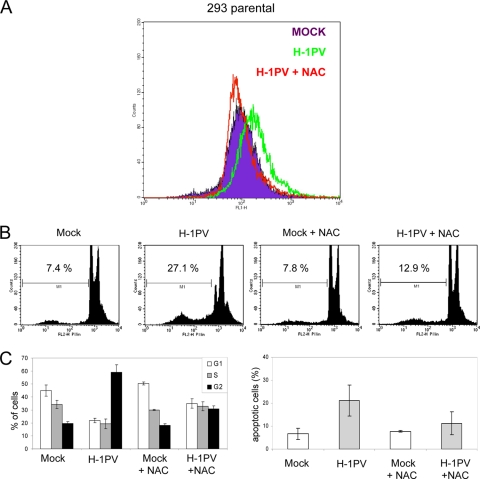
FIG. 8.
ROS play a key role in the apoptotic pathway induced by H-1PV. Mock-treated parental 293 cells (MOCK) were compared with cells infected with H-1PV (MOI, 10 PFU/cell) in the presence (H-1PV+NAC) or absence (H-1PV) of NAC. Intracellular ROS levels (A), cell cycle distribution, and sub-G1 apoptotic cell population (B and C) were determined at 24 h and 72 h, respectively, as described in the legend to Fig. 7. Data shown in panel C are average values with standard deviation bars resulting from three independent experiments performed in triplicate.

