FIG. 1.
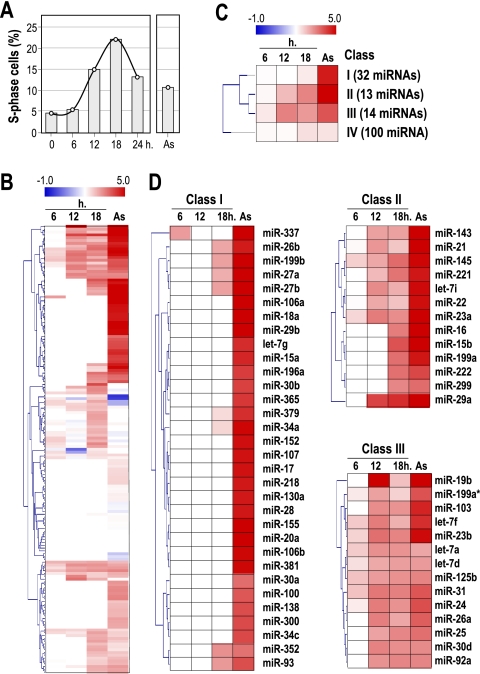
Transcriptional profile of miRNAs during the cell cycle. (A) Primary mouse embryonic fibroblasts (MEFs) were arrested by serum starvation, and entry into the cell cycle was stimulated by the addition of serum. These MEFs peak in S phase at about 18 h after stimulation with serum, as detected by DNA content analysis. (B) Expression profile of miRNAs during the G1/S transition and in asynchronously growing cells (As). Data are normalized versus the levels of expression in serum-starved cells (G0). Red indicates overexpression, and blue indicates downregulation compared to that of G0 cells. (C) Clustering of miRNAs (SOTA analysis) by their expression profile. Class I contains miRNAs that are upregulated in asynchronously growing cells, whereas miRNAs that are not significantly modulated by stimulation with serum are included in class IV. Classes II and III contain miRNAs upregulated 6 to 12 h after cell cycle entry by serum stimulation. (D) Expression profiles of miRNAs belonging to classes I, II, and III during cell cycle entry.

