FIG. 5.
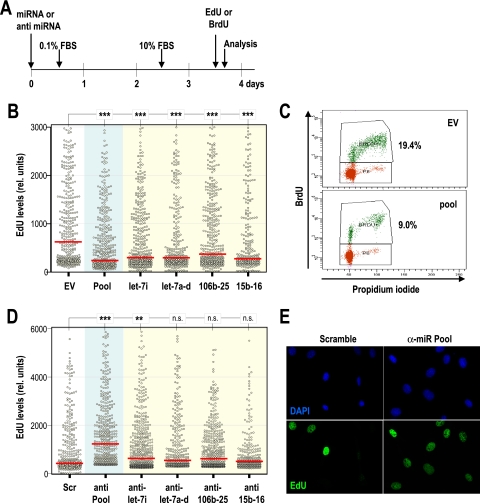
E2F-induced miRNAs inhibit entry into S phase. (A) Schematic representation of the protocol followed to test the effect of microRNAs during cell cycle entry. Different miRNA clusters or anti-miRNA oligonucleotides were transfected in MEFs, and cells were arrested for 48 h without serum. Cells were harvested 18 h after serum stimulation and a 4-h pulse of EdU or BrdU. (B) Distribution of EdU intensity (relative units) per nucleus by high-throughput microscopy after transfection with individual miRNA clusters (yellow background) or a pool of the clusters (let-7i, let-7a-d, mir-15b-16-2, and mir-106b-25; blue background) that scored positive for direct interaction with E2F by ChIP analysis (Fig. 4). All individual clusters and the pool displayed significant inhibition of DNA replication in this assay. EV, empty vector. (C) Representative profiles of BrdU incorporation, as detected by cell cytometry, showing a significant reduction in progression into S phase after expression of the pool of miRNA clusters. (D) Distribution of EdU intensity per nucleus by high-throughput microscopy after transfection with anti-miRNA oligonucleotides against individual miRNA clusters (yellow background) or a pool of clusters (blue background). Scramble sequences (Scr) were used as a control. (E) Immunodetection of EdU (green) in MEFs transfected with scramble sequences or the pool of oligonucleotides against E2F-induced miRNAs (anti-miR pool). DNA is shown in blue after staining with DAPI (4′,6-diamidino-2-phenylindole). In panels B and D, red bars indicate median values. The statistical analysis was performed using Student's t test. ***, P < 0.001; **, P < 0.01; n.s., not significant (P > 0.05).

