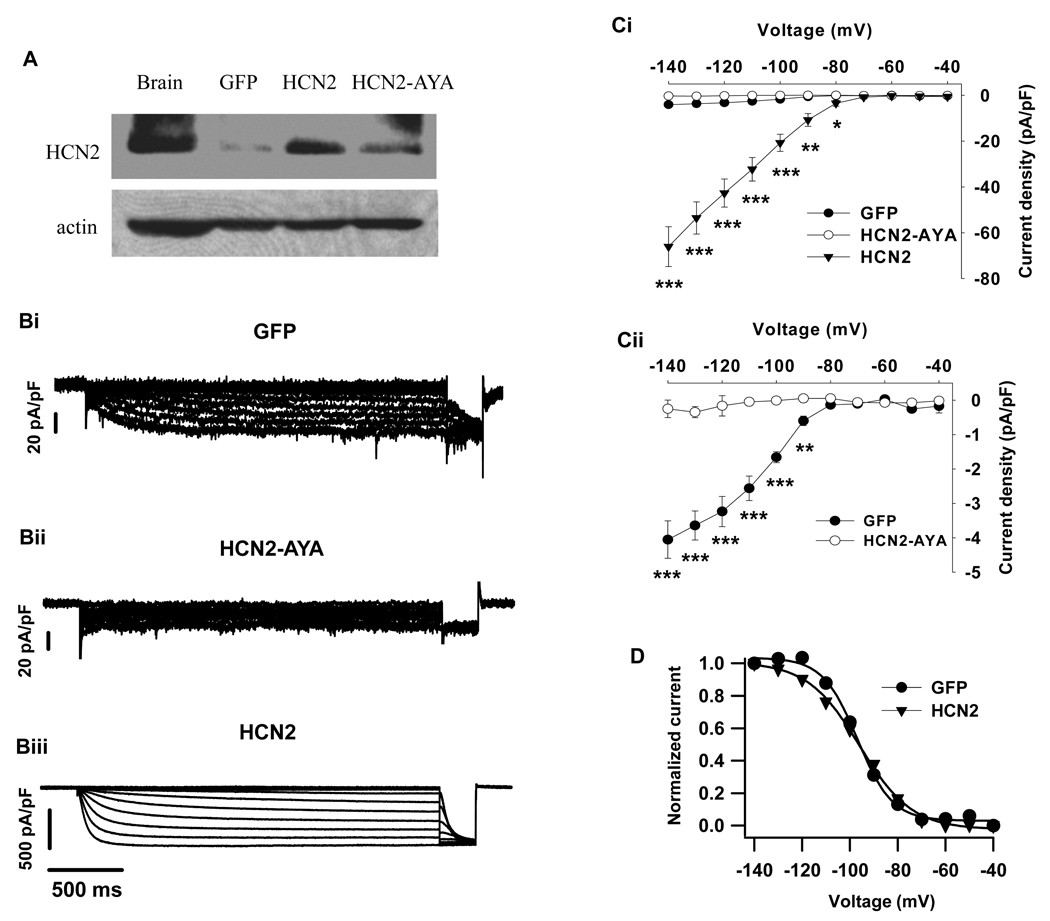
Figure 3. Effects of up-regulation and dominant-negative suppression of HCN channels on Ih in rat β-cells.
A. Western blotting showing the effect of HCN2 or HCN2-AYA infection on HCN2 protein levels in rat islet cells. Rat brain was used as positive control. β-actin was examined to assess the protein loading of the lanes. B. Representative current traces of Ih were recorded in GFP (Bi), HCN2-AYA (Bii) and HCN2-transduced cells (Biii). Different vertical scales were indicated. Voltage protocol was identical in figure 2A and figure 3B. Ci, Steady-state current-voltage relationships were obtained by plotting the sustained inward currents with corresponding test voltages. Cii was the expanded vertical scale of Bi to clearly show the effect of HCN2-AYA on Ih compared to control. D. Steady-state voltage activation curves of Ih in GFP and HCN2-transduced cells. The tail currents measured immediately after the voltage step to −140 mV were normalized and fit by the Boltzmann function. The membrane potentials of half-maximal activation (V1/2) were obtained as −97 ± 1 mV in GFP control (n=6) and −96 ± 1 mV in HCN2 (n=6), respectively. Data shown are mean ± SEM, * p < 0.05, ** p < 0.01 and *** p < 0.001, respectively, compared with the control.

