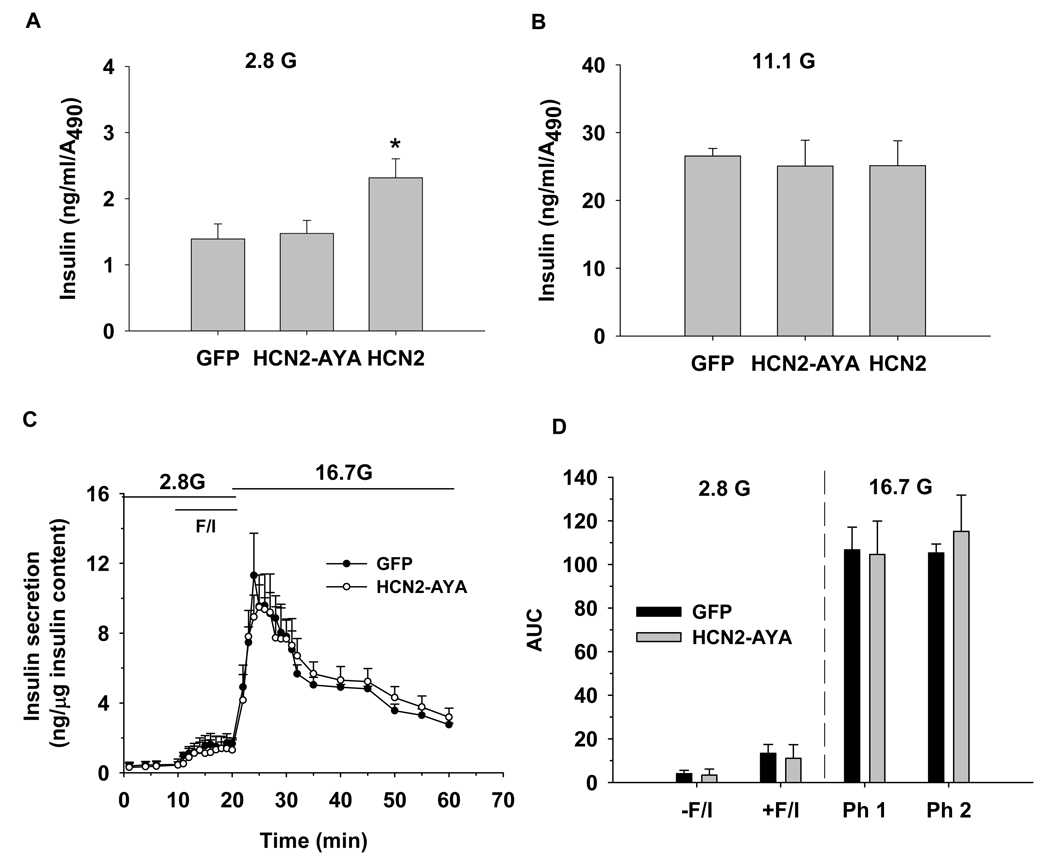
Figure 4. Influence of Ih on insulin secretion.
A–B. The islet static insulin secretion assay was performed and the amount of insulin were measured at 2.8 mmol/l glucose (2.8 G) and 11.1 mmol/l glucose (11.1 G), data were then normalized to the absorbance from XTT assay (n=5). C. The islet perifusion insulin secretion assay was performed and the amount of insulin were measured at 2.8 mmol/l glucose (2.8 G) and 16.7 mmol/l glucose (16.7 G) in the presence or absence of forskolin (10 uM) plus IBMX (100 uM), F/I indicate forskolin plus IBMX. Insulin released was normalized to total insulin content. D. Average of area under curves (AUC) of insulin levels during islet perifusion from C (n=4). The first phase (Ph1) of insulin secretion at 16.7 mmol/l glucose was quantified from 20–35 min and the second phase (Ph2) from 35–60 min from C. Data shown are mean ± SEM, * p < 0.05 compared with GFP control

