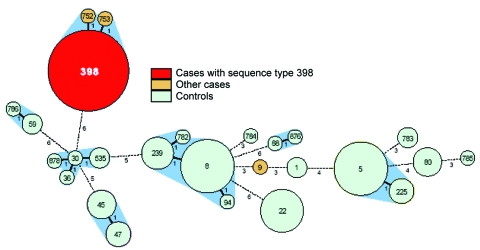
Figure 2.
Genetic relatedness of methicillin-resistant Staphylococcus aureus from cases and controls, represented as a minimum spanning tree based on multilocus sequence typing (MLST) profiles. Each circle represents a sequence type, and numbers in the circles denote the sequence type. The size of the circle indicates the number of isolates with this sequence type. The number under and right of the lines connecting types denotes the number of differences in MLST profiles. The halos surrounding the circles indicate complexes of sequence types that differ by <3 loci.

