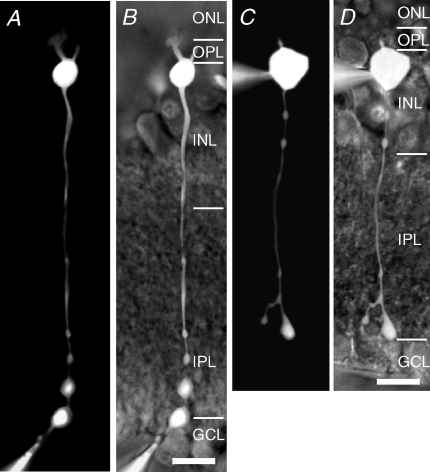
Figure 1. Rod bipolar cells in the rat retina recorded from the axon terminal or the soma.
A, composite fluorescence digital micrograph of a rod bipolar cell filled with Lucifer yellow from a recording pipette placed at the axon terminal. The micrograph was generated by assembling a series of images taken with epifluorescent illumination at different focal planes. B, micrograph in A overlaid on an infrared micrograph to show the position of the cell in the retinal slice. The retinal layers are indicated by abbreviations (ONL, outer nuclear layer; OPL, outer plexiform layer; INL, inner nuclear layer; IPL, inner plexiform layer; GCL, ganglion cell layer). Scale bar: 10 μm (A and B). C, composite fluorescence digital micrograph of a rod bipolar cell filled with Lucifer yellow from a recording pipette placed at the soma (generated as in A). D, micrograph in C overlaid on an infrared micrograph to show the position of the cell in the retinal slice. The retinal layers are indicated by abbreviations (as in B). Scale bar: 10 μm (C and D).

