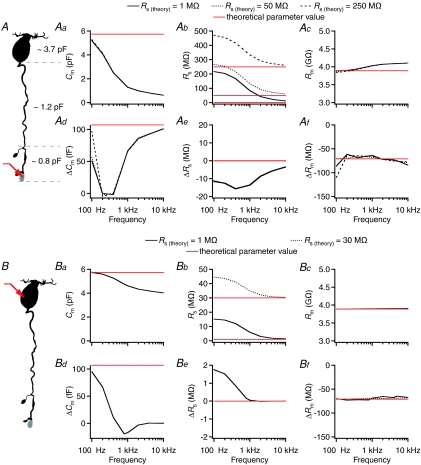
Figure 2. Performance of the ‘Sine + DC’ technique for measuring capacitance of rod bipolar cells and capacitance increase at the axon terminal with computer simulations of either terminal-end or soma-end recording.
A, shape plot of morphologically reconstructed rod bipolar cell (for details, see Oltedal et al. 2009) used for computer simulations. Red arrow indicates position of idealized single-electrode voltage clamp (SEClamp) connected to an axonal ending where a capacitance increase was simulated (grey). The total capacitance of the soma-dendritic, axonal and axon terminal compartments (demarcated by dashed grey lines) as indicated in the plot. Aa–c, estimates of total capacitance (Cm; Aa), series resistance (Rs; Ab), and total membrane resistance (Rm; Ac) as a function of sine wave stimulation frequency (100 Hz to 10 kHz) for three different values of Rs (Rs(theory); 1, 50 and 250 MΩ). Here and later, theoretical parameter values indicated by red horizontal lines. Ad–f, estimates of changes in capacitance (ΔCm; Ad), series resistance (ΔRs; Ae), and membrane resistance (ΔRm; Af) after increasing the membrane capacitance of an axonal ending by 107 fF (corresponding to an increase in surface area of 10 μm2 with specific capacitance 1.07 μF cm−2). Estimates indicated as a function of sine wave stimulation frequency (100 Hz to 10 kHz) for three different values of Rs (Rs(theory); as for Aa–c). B, as in A, but with SEClamp (red arrow) connected to soma. Ba–c (as in Aa–c) and Bd–f (as in Ad–f), SEClamp connected to soma, two different values of Rs (Rs(theory); 1 and 30 MΩ). In all simulations the sine wave voltage stimulus amplitude was ±15 mV (from Vhold=−80 mV).

