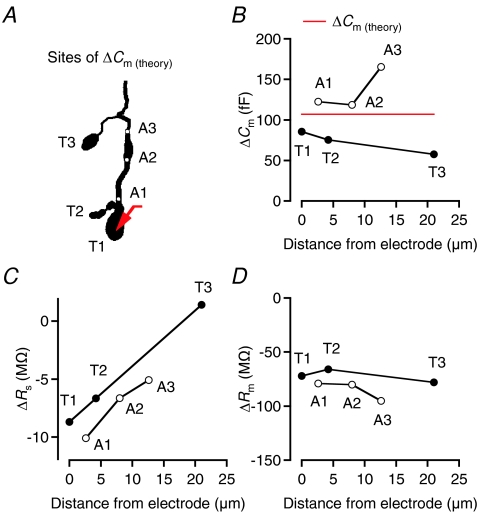
Figure 3. Accuracy of ΔCm estimates as a function of location of capacitance increase investigated by computer simulation.
A, shape plot of morphologically reconstructed rod bipolar cell used for computer simulations (same cell as in Fig. 1). Red arrow indicates position of idealized single-electrode voltage clamp (SEClamp) connected to one of the axonal endings (T1) of the axon terminal. ΔCm of 107 fF (corresponding to an increase in surface area of 10 μm2 with specific capacitance 1.07 μF cm−2) simulated at three different axonal endings (T1–T3) or three different positions in the axon terminal (A1–A3; indicated by white circles). ΔCm estimated by 2 kHz sine wave stimulation (±15 mV from Vhold=−80 mV). B–D, estimates of ΔCm (B), ΔRs (C) and ΔRm (D) as a function of location of capacitance increase, indicated as distance between the electrode (located at T1) and the location of capacitance increase.

