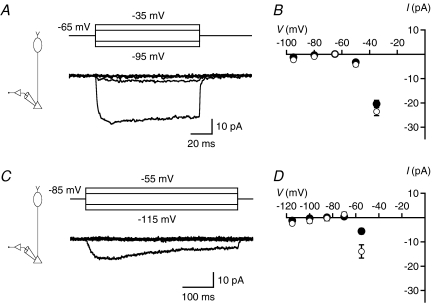
Figure 4. Voltage-gated Ca2+ currents recorded at rod bipolar axon terminals.
A, currents (lower panel) activated by ±15 and ±30 mV depolarizing (to −50 and −35 mV) and hyperpolarizing (to −80 and −95 mV) voltage pulses from Vhold=−65 mV (upper panel). Notice larger-amplitude inward current activated by depolarization to −35 mV and lower-amplitude inward current activated by depolarization to −50 mV. Subtraction of leak and capacitive currents performed by standard P/N protocol (leak pulse amplitude 1/4 of original stimulus amplitude, 10 leak pulses; A and C). Recording configuration indicated in left diagram (A and C). B, current–voltage (I–V) relationships for Ca2+ currents (as in A; n= 17 cells) measured at peak (open symbols) or at steady state (filled symbols; average of last 50 ms of response). Data points represent mean ±s.e.m. (B and D). C, currents (lower panel) activated by ±15 and ±30 mV depolarizing (to −70 and −55 mV) and hyperpolarizing (to −100 and −115 mV) voltage pulses from Vhold=−85 mV (upper panel). Notice larger-amplitude inward current activated by depolarization to −55 mV. D, I–V relationships for Ca2+ currents (as in C; n= 6 cells) measured at peak (open symbols) or at steady state (filled symbols; average of last 250 ms of response).

