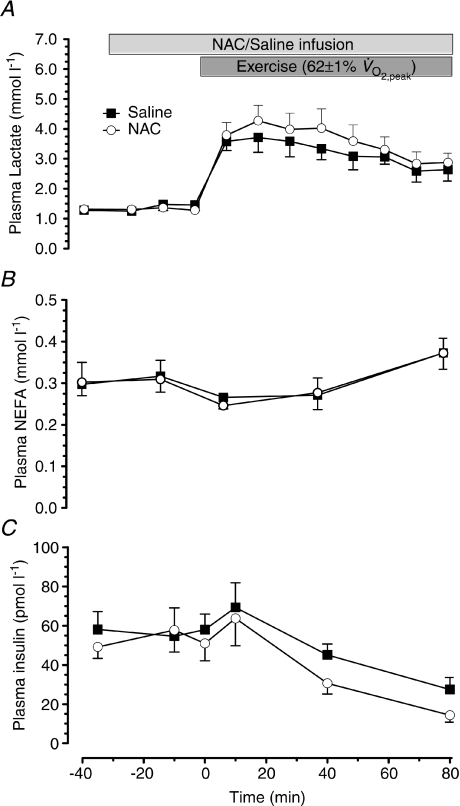
Figure 4. Plasma lactate, non-esterified free fatty acids and insulin concentration.
Plasma lactate (A), non-esterified free fatty acids (NEFA; B) and insulin (C) concentration at rest and during 80 min of steady-state exercise at 62 ± 1% while receiving either saline or saline +N-acetylcysteine (NAC) infusion. N= 9.

