
Figure 3.
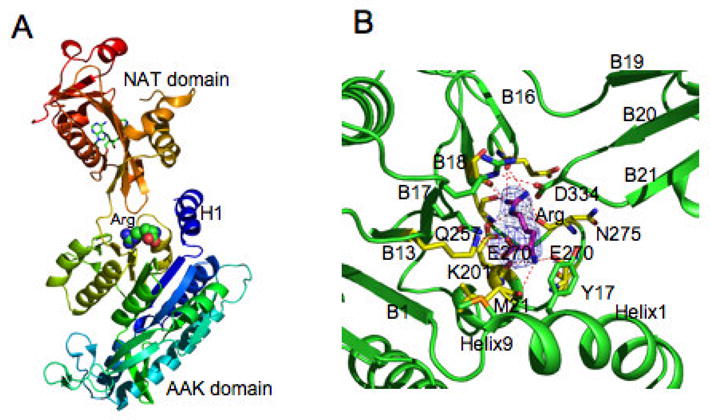
N. gonorrhoeae NAGS L-arginine binding site in the T-state structure. A. Ribbon diagram of T-state monomer. Ribbons are shown in rainbow colors from blue (N-terminal) to red (C-terminal). Bound L-arginine is represented as space-filling models. Bound CoA is shown as green sticks. B. Arginine binding site. Electron density maps (2Fo-Fc) are shown as a blue cage contoured at 1.0σ. Carbon atoms of L-arginine are shown as pink sticks. Carbon atoms of the side chains to interacts with L-arginine directly and indirectly are shown as yellow and green sticks, respectively. Hydrogen bonds between bound ligands and protein are indicated by red dashed lines.