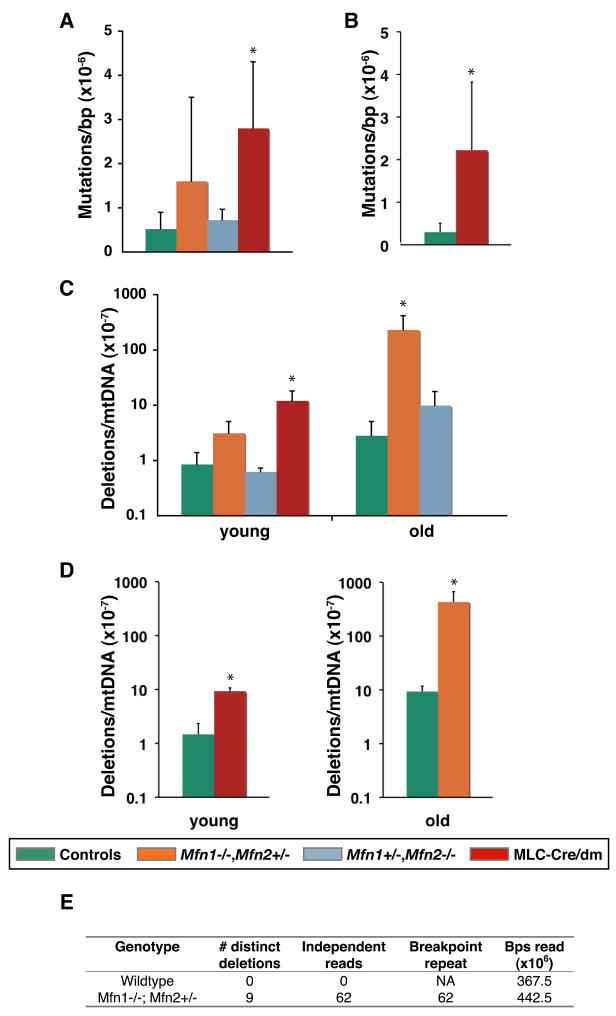
Figure 4. Quantitative analysis of mtDNA mutations.
(A–D) Quantification of mtDNA mutations in TA muscle by the random mutation capture assay. Legend for genotypes applies to panels A–D. Error bars indicate standard deviations from 3–5 animals. Asterisks denote statistically significant changes from control. P-values were obtained from unpaired t-tests. (A, B) Quantification of point mutation frequency per basepair at two independent sites. P=0.03 in (A); P=0.05 in (B). (C, D) Quantification of deletion frequency per mtDNA genome at two independent sites. In (C), P=0.01 for young muscle (7–8 weeks), and P=0.02 for old muscle (8–13 months). In (D), P=0.0003 for young muscle, and P=0.04 for old muscle. In total, approximately 250 million basepairs were screened for point mutations, and 700 million genomes for deletion. (E) Tabulation of mtDNA deletion events from Solexa sequencing of mtDNA from 10-month skeletal muscle of the indicated genotypes. “Breakpoint repeat” indicates the number of deletions involving direct repeats of 6–14 basepairs. See also Figure S4 and Table S1.

