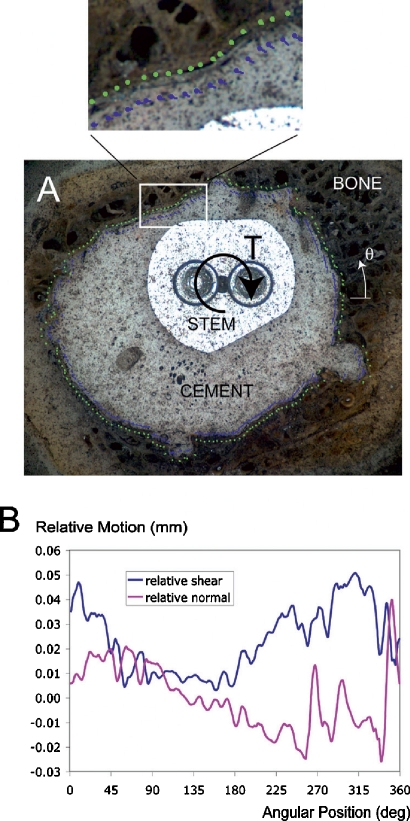
Figure 2.
A digital image correlation technique was used to quantify displacements adjacent to the interfaces (panel A). This example from donor bone C shows motion of the cement (blue vector lines) and bone (green vector lines) along the cement-bone interface. These were further decomposed into relative normal motion and shear motion at the interface as a function of angular position (panel B). Angular position (Θ) increases in a counter-clockwise direction with 0 degrees starting from a horizontal line, as shown in panel A.

