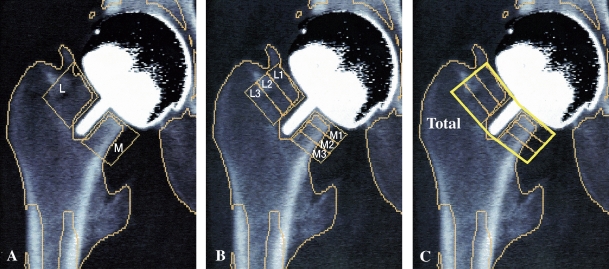
Figure 2.
A. The 2-ROI model with a medial (M) and a lateral (L) region. The length of a region was equal to the pin length in the on-screen image. The width of the region corresponded to the distance from the pin to the rim of the femoral component. B. The 6-ROI model. The on-screen pin length was divided by 3 to create 6 subregions: 3 medial regions (M1-3) and 3 lateral regions (L1-3), again with width defined by pin and rim. C. All 6 subregions combine to make the 1-ROI (total) model.

