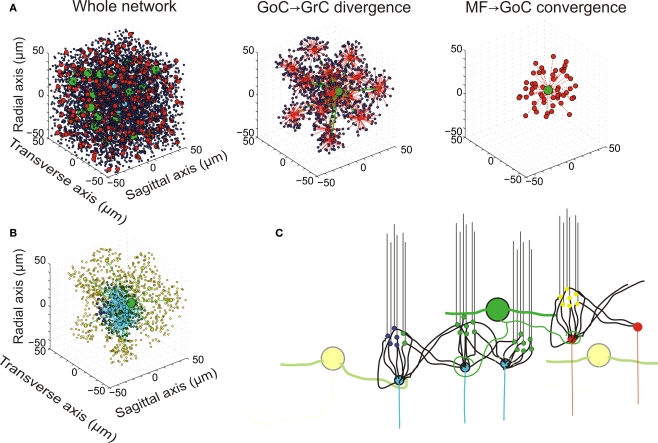
Figure 1.
Network topology. (A) Elements of the network. (i) The whole network: the granular layer network was simulated as a cube with edge length 100 μm. It contained 4096 GrCs (blue dots), 27 GoCs (green spheres), and 315 glomeruli (red and cyan dots). The meaning of the eight glomeruli indicated with cyan dots is explained in (B). (ii) GoC–GrC divergence: the panel shows the glomeruli reached by a single GoC axon and GrCs inhibited therein. (iii) Mf–GoC convergence: The panel shows the glomeruli reaching a single GoC. Note that GoC–GrC divergence is wider than mf–GoC convergence, setting the basis for lateral inhibition. (B) Neurons responding to an input burst delivered to a small mf bundle. In this example, which is drawn from the network shown in (A), eight glomeruli represented with cyan dots were supposed to delivered a burst (five spike at 500 Hz) to the network. One of the GoCs excited by the burst [the same as in (ii)] is indicated with a large green dot. The GrCs are indicated with small dots: GrCs that are only inhibited are yellow, GrCs that are only excited are blue, GrCs that are both excited and inhibited are green. Note that excitation is concentrated in the center and inhibition in the surround. (C) Schematic drawing of network connectivity [same color code as in (B)].

