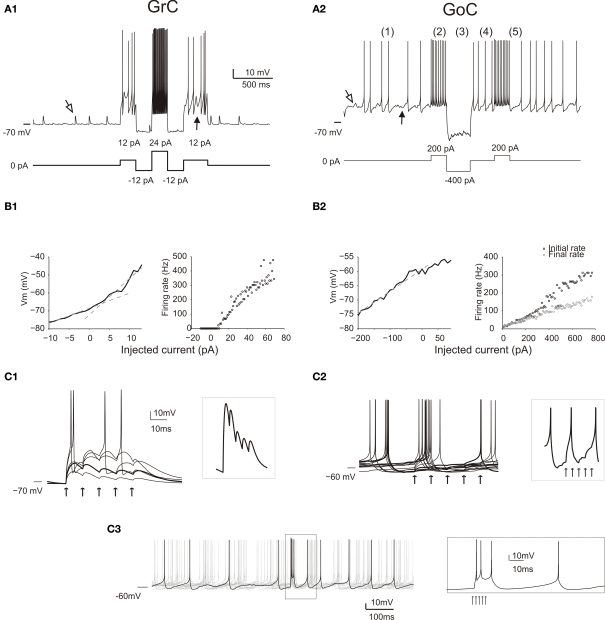
Figure 2.
Responses of GrCs and GoCs in the network. (A) The response of a GrC (A1) and a GoC (A2) to current injection. As in all the following simulations, the neurons are affected by background activity. The GrCs show EPSPs (open arrow) caused by mf activity and IPSPs (filled arrow) caused by GoC activity (the IPSPs are only visible when the neuron is depolarized, since GABA-A receptor Cl− reversal potential is almost coincident with resting potential). The GoC shows a low-amplitude synaptic noise, caused by mf and pf EPSPs (open arrow) and by SC/BC IPSPs (filled arrow), and low-frequency spiking due to intrinsic pacemaking. Both the GrC and the GoC maintain their characteristic discharge patterns previously described in slice preparations. The GrC shows a discharge proportional to injected current. The GoC shows (1) pacemaking, (2) spike frequency adaptation during depolarization, (3) sagging inward rectification, (4) rebound excitation following hyperpolarization, (5) phase reset after a high-frequency burst. (B) Input–output relationships for a GrC (B1) and a GoC (B2) in response to current injection. The GrC shows fast inward rectification (the V/I curve is fitted with two straight lines, with slope corresponding to input resistance of 842 MOhm and 2 GOhm, respectively). The GrC shows an almost linear spike frequency increase up to 500 Hz. The GoC does not show fast inward rectification (the V/I curve is fitted with a single straight lines, with slope corresponding to input resistance 80 MOhm). The GrC shows an almost linear spike frequency increase up to 300 Hz and a rapid adaptation nearly halving the firing frequency. (C) The effect of an input spike burst (five spikes at 100 Hz on eight contiguous mfs) on GrCs (C1) and GoCs (C2, C3). Examples are taken from neurons receiving a variable number of mf inputs. The GrCs (C1) receive from one to five active inputs. With weak activation EPSP short-term depression is visible (thick trace also enlarged in the inset), while with strong activation the GrCs emit short spike bursts. When the GoC receives eight active mf inputs (C2), the different traces show a single spike occurring at different phases of the pacemaking cycle followed by phase reset. Individual EPSPs are small and barely visible (thick trace also enlarged in the inset). When the GoC receives 45 mf inputs (5 spikes at 500 Hz) (C3), the traces show a short burst of two to three spikes at high frequency followed by phase-reset. The spikes in the burst (see inset) arise in 1.5 ms after the stimulus and then occur after 3.3, 7.6 and 47.2 ms.

