Figure 7.
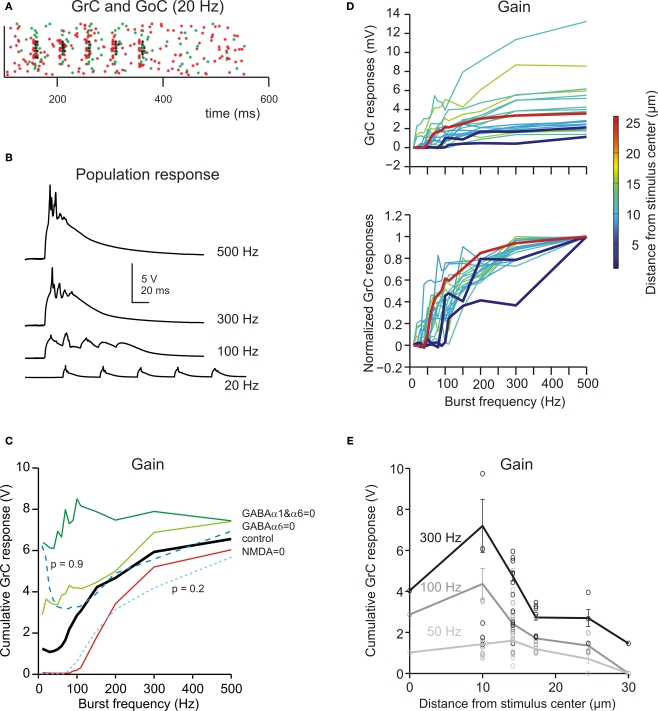
Frequency-dependence of granular layer responses. (A) The raster plot shows the response of all GrCs (blue dots) and GoCs (green dots) to a bursts (five spikes at 20 Hz) on eight contiguous mfs (red dots). (B) The GrC membrane potential (traces are the sum over all active GrCs) shows poor temporal summation at low stimulation frequency (20 Hz) but marked temporal summation at high frequencies (>100 Hz). (C) The gain function showed a steep increase above 50 Hz. By blocking the NMDA receptors, the responses were depressed with a specific loss of transmission at low frequency. By blocking GABA receptors, the responses were enhanced with a more marked increase of transmission at low frequency. Reducing release probability (p = 0.2) depressed the gain curve at all frequencies, while raising release probability (p = 0.9) enhanced the gain curve specifically at low frequency. (D) The gain curve changed from the center to surround of the excited area. In the center the gain curve arose at lower frequencies and attained higher gain than in the surround. (i) shows absolute gain curves, (ii) shows normalized gain curves. Each gain trace is from a different GrC. (E) Gain as a function of distance from the center of the active areas. The points are measures in responding spots located along different radii (mean ± sd indicate the values along the whole circumference at the given distance; see Materials and Methods for details). The difference between center and surround in terms of gain was more pronounced at high than low input frequency.

