Figure 8.
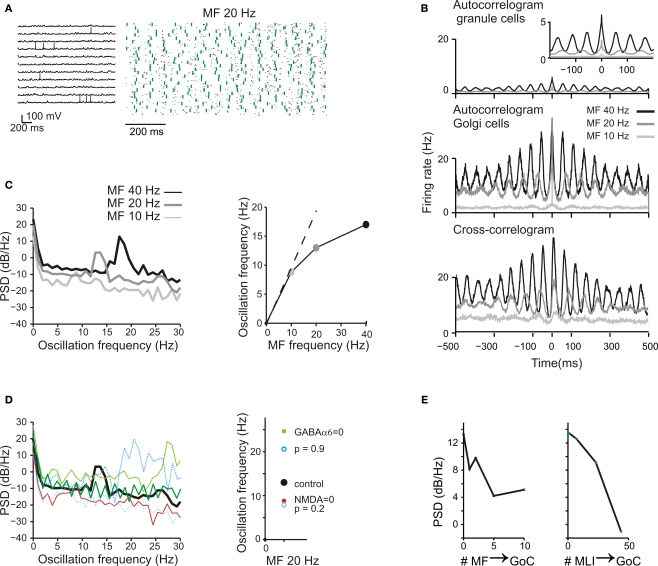
Background activity and oscillations. (A) The response of GrCs and GoCs to a 20-Hz mf random activity. Activity of individual GrCs was sparse and appeared to occur at random and uncorrelated times [membrane potential traces, (i)]. However, when represented in a raster plot (ii), GrC (blue dots) and GoC (green dots) activity appeared organized in a repetitive coherent pattern. (B) Autocorrelograms of GrC and GoC population activity at three different frequencies of the random input (10 Hz, 20 Hz, 40 Hz; (i,ii)). The autocorrelogram of GrCs is enlarged in the inset. The cross-correlogram shows the mean activity of the GoCs in relation to spikes fired by GrCs (iii). (C) The power spectrum density (PSD) of the GrC population activity shows a peak between 7 and 20 Hz at the three different input frequencies [(i): 10 Hz, 20 Hz, 40 Hz]. These peaks are represented as a function of the input frequency in (ii). (D) The effect of altering neurotransmission mechanisms on the GrC power spectral density generated with a 20-Hz mf random activity. Blocking NMDA receptors reduced the PSD peak frequency, while blocking GABA-A receptors increased the PSD peak frequency. Decreasing mf-GrC release probability (p = 0.2) reduced the PSD peak frequency, while increasing mf-GrC release probability (p = 0.9) increased the PSD peak frequency. (E) The effect of altering the strength of GoC excitation through the mfs and of GoC inhibition through MLI on the GrC power spectral density generated with a 20-Hz mf random activity. The oscillatory effect, revealed by the intensity of the GrC PSD, tends to vanish as the intensity of the feed-forward inhibitory loop is increased and as the intensity of the feed-back dis-inhibitory loop is increased.

