Figure 1.
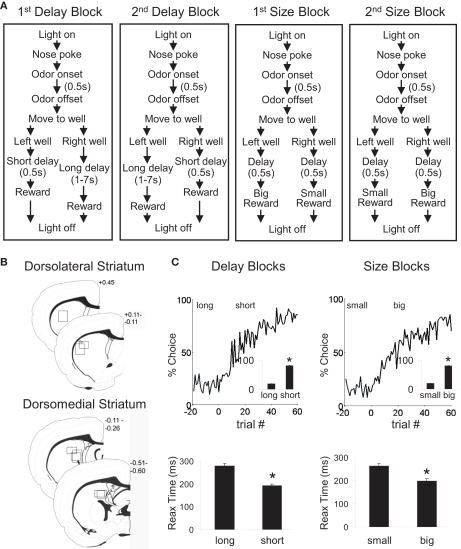
Task structure, recording sites and behavioral data. (A) Shown are the sequences of events for trials during delay and size blocks. Each session consisted of four blocks, two delay blocks and then two size blocks. The short and long outcomes were randomly assigned to left or right on the first block, and on each subsequent block, the preferred outcome alternated sides. (B) Boxes show the estimated dorsal/ventral and medial/lateral extent of recording sites, based on the final position of the electrode. The range of the estimated rostral/caudal position, relative to bregma, is labeled on the figures. (C) Average choice rate, collapsed across direction, for the block transition from long delay to short delay or from small size to big size. The last 20 trials of the previous block are shown in gray shading. Note that each transition from long to short and small to big is accompanied by a transition, for the opposite response, in the opposite direction (i.e. from short to long and from big to small). Therefore, because choice rates for both responses must sum to 100%, the choice rates shown in these figures actually represent transitions in both directions. The bar graphs in the insets show average percent choice ± SEM of long vs. short delay or small vs. big size in the last 20 trials of blocks. Bar graphs in the lower panels show average reaction time (from odor offset to odor port exit) ± SEM on correct forced-choice trials on which the outcome was long vs. short delay, or small vs. big size, taken from the last 20 trials of all blocks. *p < 0.01 by t-test vs. opposite outcome.

