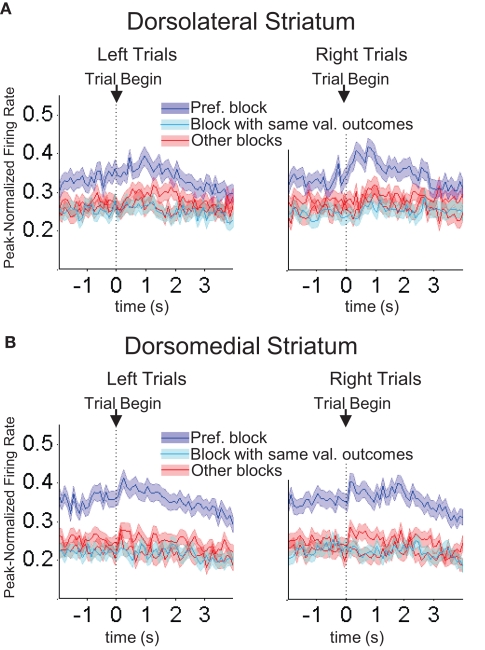
Figure 10.
Baseline firing rates reflect available outcomes in both dorsolateral (A) and dorsomedial (B) striatum. Curves show average peak-normalized firing rates (±SEM) during the last 20 forced-choice trials of each block, aligned on the beginning of the trial, collapsed across each neuron's preferred block (designated according to the block with the highest average firing rate). Neurons in these populations showed an elevated baseline firing rate during their preferred block. Populations included all neurons with a significant effect of block, but no effect of direction. (99 out of 489 recorded in dorsolateral; 112 out of 587 recorded in dorsomedial).

