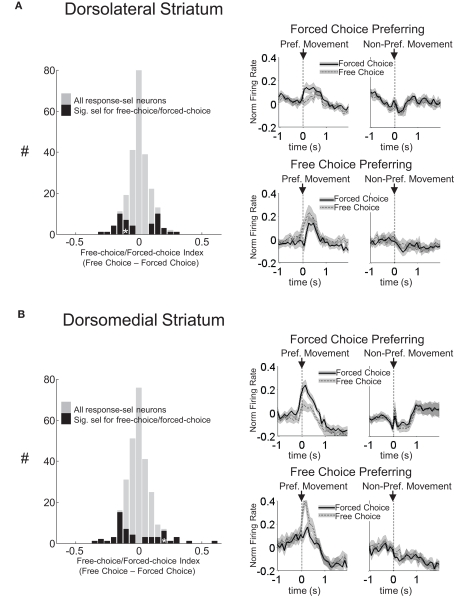
Figure 4.
Neurons selective for the response during the movement epoch in both dorsolateral (A) and dorsomedial (B) striatum show characteristics consistent with S–R encoding. Histograms on the left show the free-choice/forced-choice index (average peak-normalized firing rate on free-choice trials minus that on matched forced-choice trials across all blocks) for all response-selective neurons. Those plotted in black are significantly selective for either forced-choice trials (negative values) or free-choice trials (positive values). Significance was tested using a paired t-test (p < 0.05) comparing free-choice trials with forced-choice trials matched for response, outcome, and position within the block. Asterisks in the histograms show the selectivity indices of the example neurons shown in Figures 2A,C. Curves on the right show average peak-normalized firing rates (±SEM), relative to baseline, aligned on the beginning of movement towards reward, for each significantly selective population. Curves were collapsed across each neuron's preferred direction (designated according to the direction and block with the highest average firing rate).

