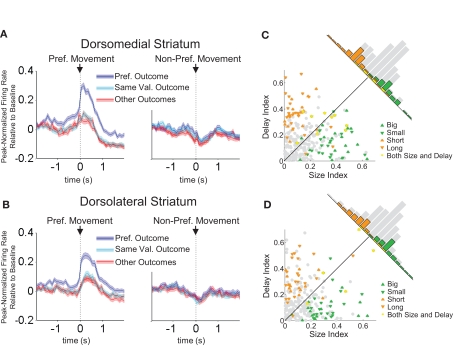
Figure 7.
Neurons selective for the response during the movement epoch are modulated by outcome in both dorsomedial and dorsolateral striatum. Curves in (A) and (B) show average peak-normalized firing rates (±SEM), relative to baseline, during the last 20 forced-choice trials of each block, aligned on the beginning of the movement towards reward. Populations included all response-selective neurons (269 out of 587 recorded in dorsomedial; 237 out of 489 recorded in dorsolateral). Curves were collapsed across each neuron's preferred direction and preferred outcome (designated according to the direction and block with the highest average firing rate). Preferred outcomes were equally distributed across the four outcomes. Scatter plots in (C) and (D) show the delay modulation index vs. the size modulation index for each response-selective neuron. Colored points indicate neurons that were significantly selective for the size modulation, the delay modulation, or both. Bar graphs show the difference between the two indices for each neuron. To the extent that outcome-modulated responses reflect the value of the response, colored points should congregate around the diagonal, the colored bars should peak in the center, and the number of neurons significantly modulated by both manipulations should exceed chance. In fact, however, in both regions colored points are significantly removed from the diagonal and neurons modulated by both manipulations are no more frequent than chance. Thus separate populations of neurons encode each response–outcome conjunction. Delay modulation index = absolute value of the difference between normalized firing rates during preferred directional response on delay block 1 and delay block 2. Size modulation index is the corresponding difference for size blocks.

