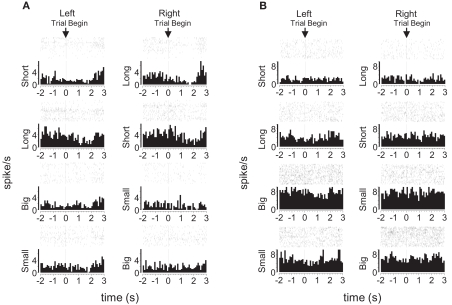
Figure 9.
Examples of block-selective single-units recorded from dorsolateral and dorsomedial striatum. Shown are raster plots and time histograms displaying firing rate during correct forced-choice trials, aligned on the beginning of the trial. Each row includes the trials from one block of the session. The unit shown in (A), from dorsolateral striatum, shifted its baseline firing rate in the block with long-delayed outcomes on the left and short-delayed outcomes on the right. The unit shown in (B), from dorsomedial striatum, shifted its baseline firing rate in the block with big outcomes on the left and small outcomes on the right. Blocks are shown in the temporal order in which they occurred.

