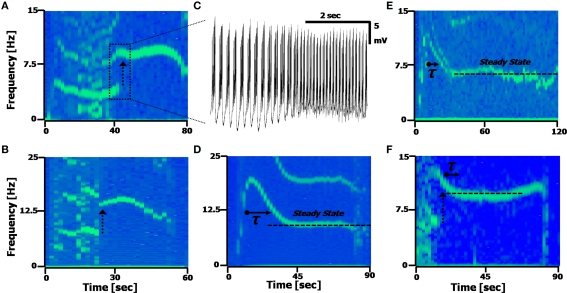
Figure 5.
Calcium frequency transitions. (A,B) Spectrograms displaying discontinuities in the frequency, with a frequency doubling of the Ca2+ spikes. Arrow represents the frequency doubling. (A) Shift from 4.5 to 9 Hz; (B), shift from 7 to 14 Hz. (C) Time-domain recording of the transition point between the two frequencies occurring in (A). (D,E) Spectrograms displaying a transient decay to a steady state frequency. (C) τ = 7.2 s; (D) τ = 8.1 s. The second harmonic artifact of the Ca2+ spikes is distinctly visible in (A,B and D). (F) A spectrogram displaying both a frequency doubling, followed by a steady-state recovery transient.

