Figure 6.
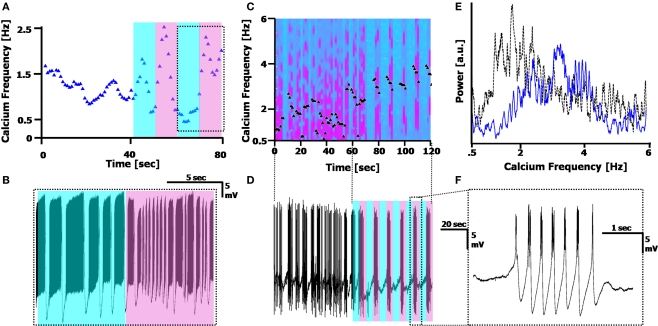
Reversible photo-switching of the calcium frequency. (A) Frequency tracking the Calcium frequency range of a cell in 50 μM of the reversibly photo-switchable kainate receptor agonist, with 10 s cyan, 10 s UV illumination (500 and 380 nm, respectively; shaded region). The Calcium frequency rises under UV illumination, and generally decreases in cyan illumination. (B) Recording of the cell during the 10/10 illumination pattern is delineated in the dotted box in (A), displaying the frequency change. (C) Spectrogram of the Calcium frequency before (0–60 s) and during (60–120 s) illumination with 5 s cyan/5 s UV, in the presence of 100 μM photo-switchable agonist, 1 μM TTX and 10 μM GYKI. Black triangles mark the peak position of the Calcium frequency. (D) Recording of the cell, displaying the illumination pattern. The time scale matches that of (C). (E) Fourier spectrum of the Calcium frequency before (dotted black line) and during (solid blue line) illumination, displaying the rightward shift in Ca2+ spikes during (UV) illumination. This spectrum does not provide information on the Switching frequency (out of range). (F) A single burst of Ca2+ spikes during one of the UV illumination cycles in (D).

